MRI/CT-calculated Total Kidney Volume
Total kidney volume (TKV) is a strong predictor of future renal insufficiency in ADPKD.1 Various imaging modalities (MRI, CT, US) and post processing methods (stereology and ellipsoid calculations) are available to determine TKV.1,2
Once TKV has been calculated, it can be used to assess the risk of ADPKD progression in Typical (Class 1) patients, more specifically by estimating TKV growth and eGFR decline over time. This method can be useful in assessing younger patients who may still have normal eGFR levels.2,3
For Atypical (class 2) patients, ADPKD progression should be classified using an expanded imaging classification model which employs a recalculated htTKV measure that excludes prominent exophytic cysts to improve prediction for eGFR decline.4
View a hypothetical patient sample calculation or enter practice values to
learn how to measure TKV to assess disease progression:
How to Measure TKV using MRI or CT images and the ellipsoid volume equation
Determining TKV by stereology can be time-consuming and depends on specialized software that is not available to all clinicians. Estimation of TKV by the ellipsoid volume equation (shown below) requires only a few minutes and has sufficient precision to substitute stereology in the classification assignment.2,3
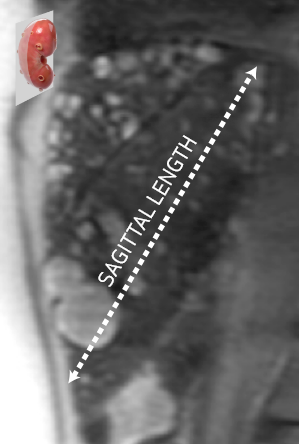
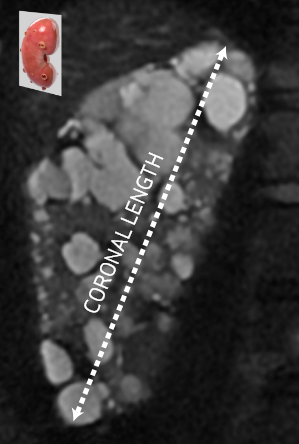
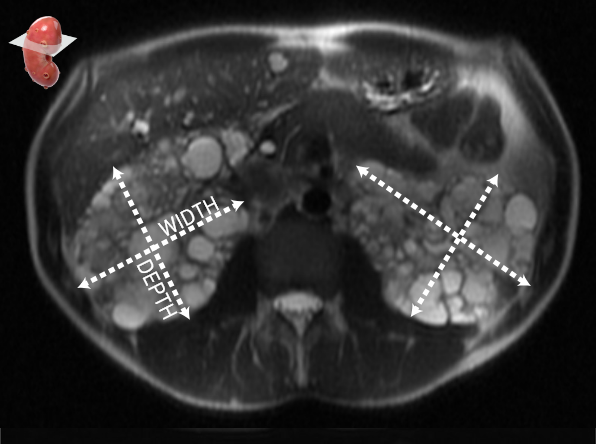
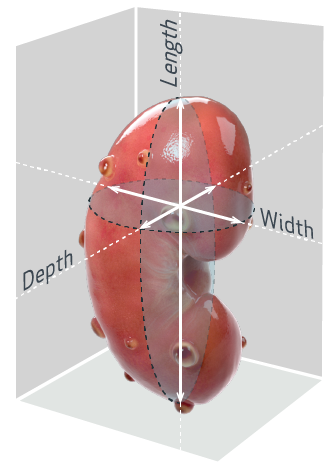
The ellipsoid volume equation uses length, width, and depth measurements determined from the sagittal, coronal and transverse views of an MRI or CT scan.*3,5
Sagittal View
Coronal View
Transverse View
* Imaging services such as MRI or CT may not be available in all cases. Radiologists may take a different approach than the example provided to determine kidney length, width and depth measurements from MRI or CT scans.
*Length. The length can be obtained by averaging the maximum longitudinal diameters taken from coronal and sagittal images. Alternatively, a single, longitudinal diameter measurement can be obtained from a tilted coronal image.3,4
†Width and depth. Use the width and depth of the kidney obtained from transverse images at the maximum transverse diameter.3
basic formula:
kidney values:
for final volume:*
How to Use TKV to Assess Risk for ADPKD Progression
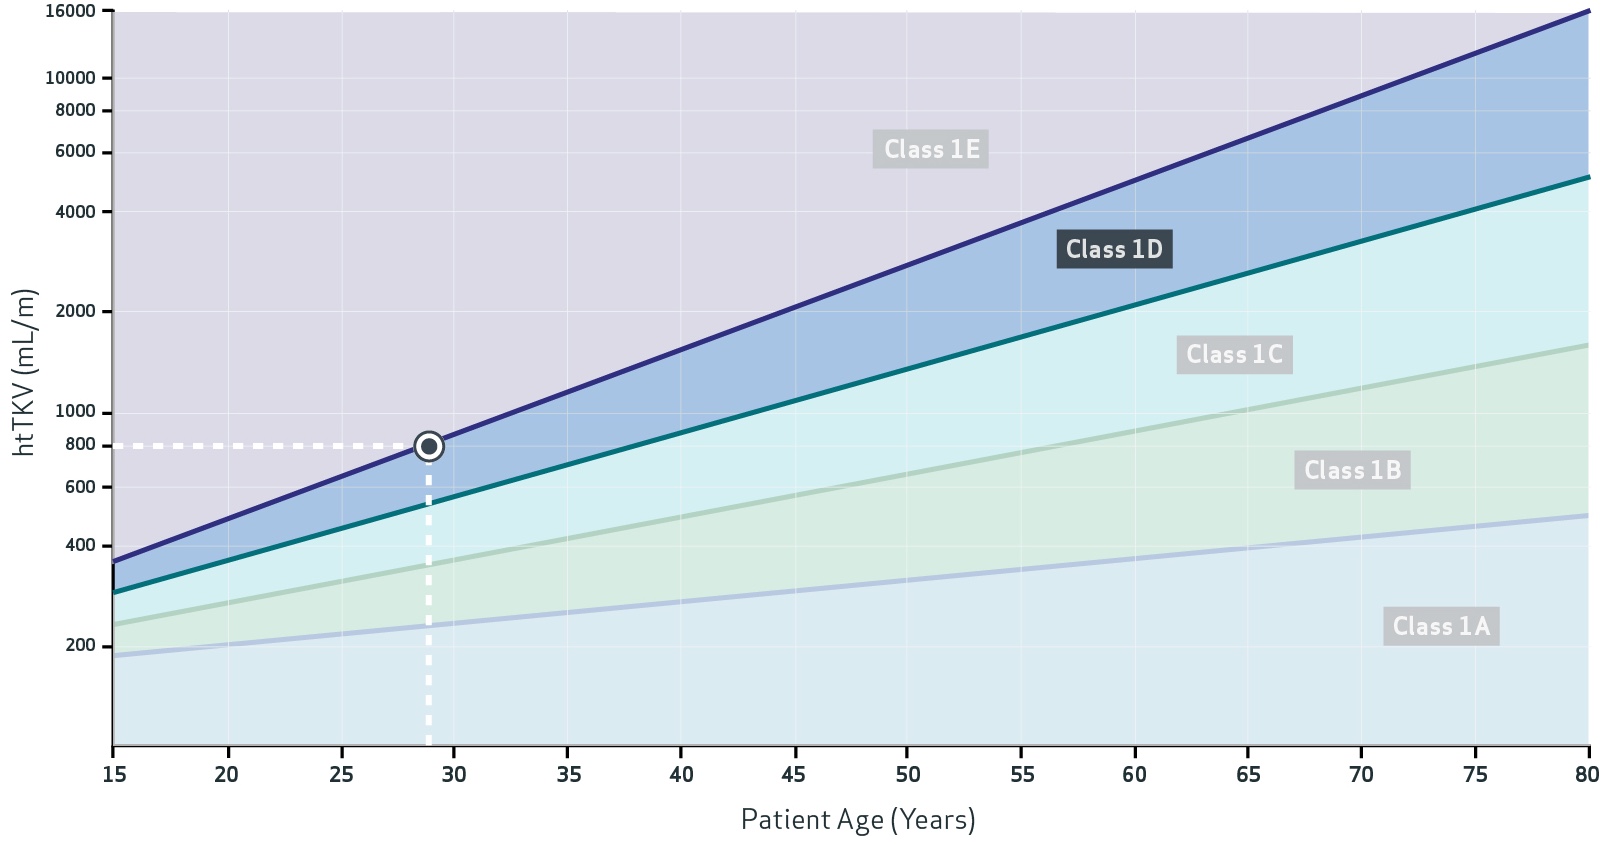
With height-adjusted TKV (htTKV), you can see Patient A's classification for annual kidney growth and risk for eGFR decline.3
basic formula:
and calculate:
ADPKD Imaging Classification by htTKV and Age*
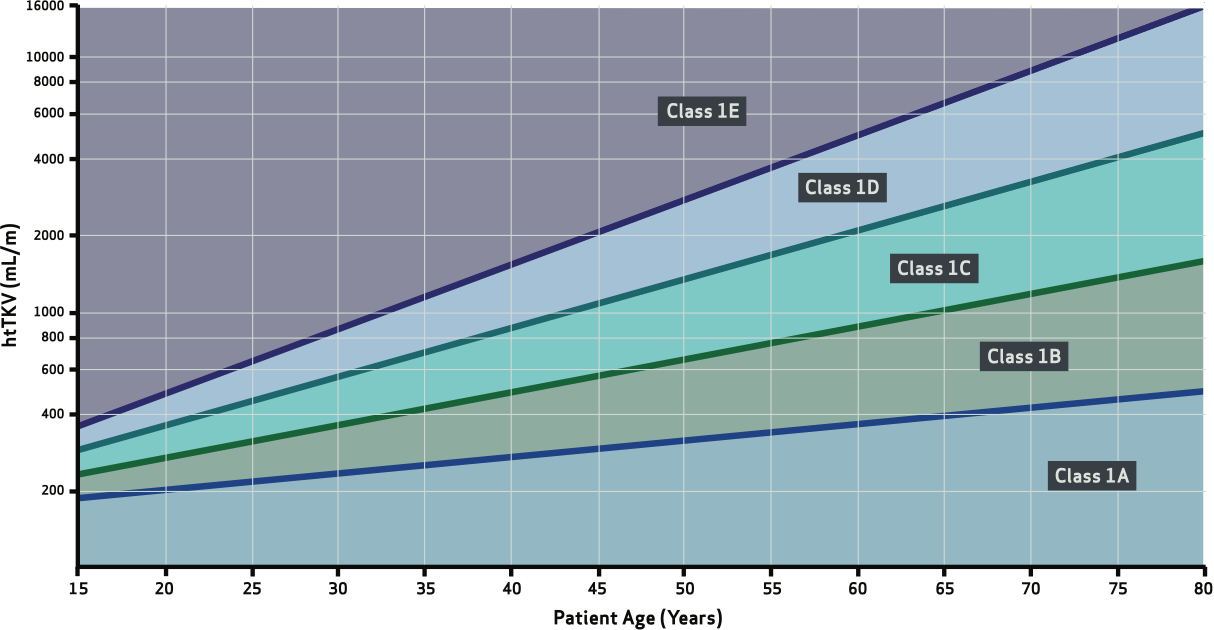
Patient Classifications*
Adapted with permission of The American Society of Nephrology, from Irazabal MV, et al. Imaging classification of autosomal polycystic kidney disease: a simple model for selecting patients for clinical trials. J Am Soc Nephrol. 2015;26(1):160-172.
Patient A is likely at high risk for rapid progression.
The information provided on the ADPKDsim website is intended for your educational benefit only. It is not intended as, nor is it a substitute for medical care or advice or professional diagnosis.
Health care professionals should use their independent judgment when reviewing the ADPKDsim's educational resources. Users seeking medical advice should consult with a health care professional.